Statsmodel
In [1]:
import numpy as np
import pandas as pd
import statsmodels.api as sm
import statsmodels.formula.api as smf
import matplotlib.pyplot as plt
import seaborn as sns

%matplotlib inline
In [2]:
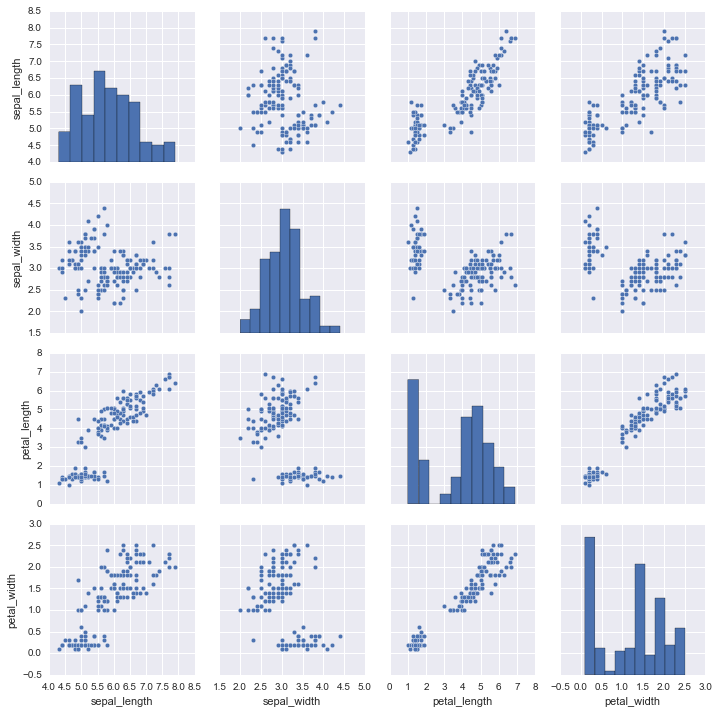
iris = sns.load_dataset("iris")
iris.tail()
Out[2]:
| sepal_length | sepal_width | petal_length | petal_width | species | |
|---|---|---|---|---|---|
| 145 | 6.7 | 3.0 | 5.2 | 2.3 | virginica |
| 146 | 6.3 | 2.5 | 5.0 | 1.9 | virginica |
| 147 | 6.5 | 3.0 | 5.2 | 2.0 | virginica |
| 148 | 6.2 | 3.4 | 5.4 | 2.3 | virginica |
| 149 | 5.9 | 3.0 | 5.1 | 1.8 | virginica |
In [3]:
sns.pairplot(iris)
Out[3]:
<seaborn.axisgrid.PairGrid at 0x1053c7358>
In [4]:
model = sm.OLS(iris.sepal_length, iris.sepal_width)
fitted = model.fit()
In [5]:
fitted.summary()
Out[5]:
| Dep. Variable: | sepal_length | R-squared: | 0.957 |
|---|---|---|---|
| Model: | OLS | Adj. R-squared: | 0.956 |
| Method: | Least Squares | F-statistic: | 3277. |
| Date: | Sun, 03 Apr 2016 | Prob (F-statistic): | 2.42e-103 |
| Time: | 01:31:50 | Log-Likelihood: | -243.98 |
| No. Observations: | 150 | AIC: | 490.0 |
| Df Residuals: | 149 | BIC: | 493.0 |
| Df Model: | 1 | ||
| Covariance Type: | nonrobust |
| coef | std err | t | P>|t| | [95.0% Conf. Int.] | |
|---|---|---|---|---|---|
| sepal_width | 1.8690 | 0.033 | 57.246 | 0.000 | 1.804 1.934 |
| Omnibus: | 18.144 | Durbin-Watson: | 0.427 |
|---|---|---|---|
| Prob(Omnibus): | 0.000 | Jarque-Bera (JB): | 7.909 |
| Skew: | -0.338 | Prob(JB): | 0.0192 |
| Kurtosis: | 2.101 | Cond. No. | 1.00 |
In [6]:
fitted.params
Out[6]:
sepal_width    1.869009
dtype: float64
In [7]:
def attrs(obj):
    return [a for a in dir(obj) if not a.startswith("_")]
In [8]:
%pprint
Pretty printing has been turned OFF
model と 学習済みモデル
In [9]:
attrs(model)
Out[9]:
['data', 'df_model', 'df_resid', 'endog', 'endog_names', 'exog', 'exog_names', 'fit', 'fit_regularized', 'from_formula', 'hessian', 'information', 'initialize', 'k_constant', 'loglike', 'nobs', 'normalized_cov_params', 'pinv_wexog', 'predict', 'rank', 'score', 'weights', 'wendog', 'wexog', 'wexog_singular_values', 'whiten']
In [10]:
attrs(fitted)
Out[10]:
['HC0_se', 'HC1_se', 'HC2_se', 'HC3_se', 'aic', 'bic', 'bse', 'centered_tss', 'compare_f_test', 'compare_lm_test', 'compare_lr_test', 'condition_number', 'conf_int', 'conf_int_el', 'cov_HC0', 'cov_HC1', 'cov_HC2', 'cov_HC3', 'cov_kwds', 'cov_params', 'cov_type', 'df_model', 'df_resid', 'diagn', 'eigenvals', 'el_test', 'ess', 'f_pvalue', 'f_test', 'fittedvalues', 'fvalue', 'get_influence', 'get_robustcov_results', 'initialize', 'k_constant', 'llf', 'load', 'model', 'mse_model', 'mse_resid', 'mse_total', 'nobs', 'normalized_cov_params', 'outlier_test', 'params', 'predict', 'pvalues', 'remove_data', 'resid', 'resid_pearson', 'rsquared', 'rsquared_adj', 'save', 'scale', 'ssr', 'summary', 'summary2', 't_test', 'tvalues', 'uncentered_tss', 'use_t', 'wald_test', 'wresid']
statsmodel api
In [11]:
[a for a in attrs(sm) if a.isupper()]
Out[11]:
['GEE', 'GLM', 'GLS', 'GLSAR', 'OLS', 'RLM', 'WLS']
In [12]:
[a for a in attrs(sm) if a[0].isupper()]
Out[12]:
['GEE', 'GLM', 'GLS', 'GLSAR', 'Logit', 'MNLogit', 'MixedLM', 'NegativeBinomial', 'NominalGEE', 'OLS', 'OrdinalGEE', 'PHReg', 'Poisson', 'ProbPlot', 'Probit', 'QuantReg', 'RLM', 'WLS']
In [13]:
[a for a in attrs(sm) if a.islower()]
Out[13]:
['add_constant', 'categorical', 'cov_struct', 'datasets', 'distributions', 'emplike', 'families', 'formula', 'genmod', 'graphics', 'iolib', 'load', 'nonparametric', 'qqline', 'qqplot', 'qqplot_2samples', 'regression', 'robust', 'show_versions', 'stats', 'test', 'tools', 'tsa', 'version', 'webdoc']
statsmodels formula api
In [14]:
[a for a in attrs(smf) if a.isupper()]
Out[14]:
['GEE', 'GLM', 'GLS', 'GLSAR', 'OLS', 'RLM', 'WLS']
In [15]:
[a for a in attrs(smf) if a[0].isupper()]
Out[15]:
['GEE', 'GLM', 'GLS', 'GLSAR', 'Logit', 'MNLogit', 'MixedLM', 'NegativeBinomial', 'NominalGEE', 'OLS', 'OrdinalGEE', 'PHReg', 'Poisson', 'Probit', 'QuantReg', 'RLM', 'WLS']
In [16]:
[a for a in attrs(smf) if a.islower()]
Out[16]:
['gee', 'glm', 'gls', 'glsar', 'logit', 'mixedlm', 'mnlogit', 'negativebinomial', 'nominal_gee', 'ols', 'ordinal_gee', 'phreg', 'poisson', 'probit', 'quantreg', 'rlm', 'wls']
statsmodels
In [17]:
import statsmodels
In [18]:
[a for a in attrs(statsmodels) if a.isupper()]
Out[18]:
[]
In [19]:
[a for a in attrs(statsmodels) if a[0].isupper()]
Out[19]:
['CacheWriteWarning', 'ConvergenceWarning', 'InvalidTestWarning', 'IterationLimitWarning', 'NoseWrapper', 'Tester']
In [20]:
[a for a in attrs(statsmodels) if a.islower()]
Out[20]:
['api', 'base', 'compat', 'datasets', 'discrete', 'distributions', 'duration', 'emplike', 'errstate', 'formula', 'genmod', 'graphics', 'info', 'iolib', 'nonparametric', 'print_function', 'regression', 'robust', 'sandbox', 'simplefilter', 'stats', 'test', 'tools', 'tsa', 'version']
In [21]:
{k for k in plt.rcParams.keys() if "text" in k} | {k for k in plt.rcParams.keys() if "size" in k}
Out[21]:
{'mathtext.bf', 'mathtext.rm', 'text.latex.preamble', 'text.hinting', 'ytick.minor.size', 'figure.titlesize', 'agg.path.chunksize', 'mathtext.fontset', 'mathtext.fallback_to_cm', 'text.hinting_factor', 'mathtext.tt', 'mathtext.cal', 'xtick.labelsize', 'mathtext.it', 'text.color', 'legend.handletextpad', 'legend.fontsize', 'axes.formatter.use_mathtext', 'figure.figsize', 'xtick.minor.size', 'text.dvipnghack', 'text.antialiased', 'errorbar.capsize', 'axes.titlesize', 'text.latex.unicode', 'lines.markersize', 'text.latex.preview', 'xtick.major.size', 'mathtext.default', 'axes.labelsize', 'ytick.labelsize', 'ps.papersize', 'boxplot.flierprops.markersize', 'mathtext.sf', 'ytick.major.size', 'font.size', 'text.usetex'}
In [26]:
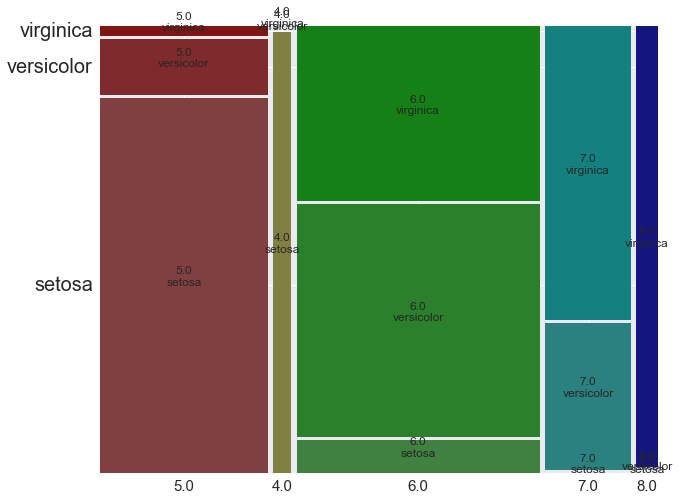
from statsmodels.graphics.mosaicplot import mosaic

iris_copy = iris.copy()
iris_copy["sepal_length_round"] = iris_copy.sepal_length.round()

# http://matplotlib.org/users/customizing.html
# http://statsmodels.sourceforge.net/stable/generated/statsmodels.graphics.mosaicplot.mosaic.html
plot_context = {
    'figure.figsize': (10, 8),
    'font.size': 18,
    'font.stretch': 18,
    'figure.dpi': 100,
    'axes.labelsize': 18,
    'axes.titlesize': 20,
    'xtick.labelsize': 15,
    'ytick.labelsize': 20,
    'legend.fontsize': 15,
    'lines.markersize': 15,
}
with plt.rc_context(plot_context):
    fig, rects = mosaic(iris_copy, ["sepal_length_round", "species"], gap=0.01)
    plt.savefig("mosaic_cm.png")

pd.DataFrame(rects)
# 0, 1, : ??
# 2: 横軸を全体とした時の構成比率
# 3: 各横軸内での構成比率
Out[26]:
| 5.0 | 4.0 | 6.0 | 7.0 | 8.0 | |||||||||||
|---|---|---|---|---|---|---|---|---|---|---|---|---|---|---|---|
| setosa | versicolor | virginica | setosa | versicolor | virginica | setosa | versicolor | virginica | setosa | versicolor | virginica | setosa | versicolor | virginica | |
| 0 | 0.000000 | 0.000000 | 0.000000 | 0.310897 | 0.310897 | 0.310897 | 0.352564 | 0.352564 | 0.352564 | 0.798077 | 0.798077 | 0.798077 | 0.961538 | 0.961538 | 0.961538 |
| 1 | 0.000000 | 0.846445 | 0.979003 | 0.000000 | 0.993421 | 1.000000 | 0.000000 | 0.079141 | 0.608166 | 0.000000 | 0.006579 | 0.342105 | 0.000000 | 0.006579 | 0.013158 |
| 2 | 0.301282 | 0.301282 | 0.301282 | 0.032051 | 0.032051 | 0.032051 | 0.435897 | 0.435897 | 0.435897 | 0.153846 | 0.153846 | 0.153846 | 0.038462 | 0.038462 | 0.038462 |
| 3 | 0.839866 | 0.125980 | 0.020997 | 0.986842 | 0.000000 | 0.000000 | 0.072562 | 0.522446 | 0.391834 | 0.000000 | 0.328947 | 0.657895 | 0.000000 | 0.000000 | 0.986842 |
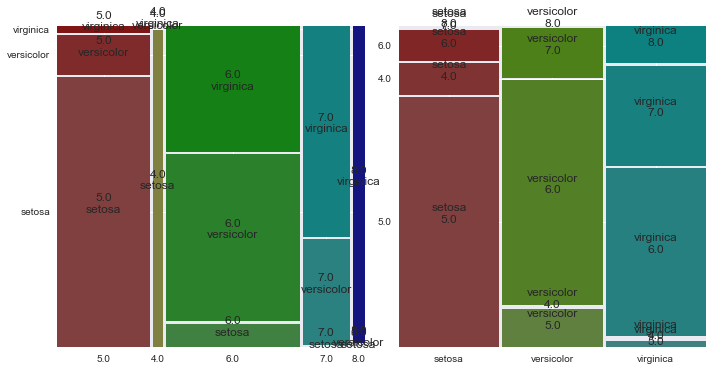
In [32]:
fig, axes = plt.subplots(1, 2, figsize=(10, 5))
index = ["sepal_length_round", "species"]
mosaic(iris_copy, index, gap=0.01, ax=axes[0])
mosaic(iris_copy, index[::-1], gap=0.01, ax=axes[1])
plt.tight_layout()
In [27]:
mosaic?