interactive
In [1]:
import pandas as pd
import scipy as sp
import seaborn as sns

%matplotlib inline
- http://qiita.com/tanemaki/items/e965cd9c25acbeed860c
- http://qiita.com/y__sama/items/654ed8ab7464718876f
- conda install pivottablejs
- conda install ipywidgets
- https://github.com/damianavila/RISE
mkdir -p ~/.local/share/jupyter/nbextensions && cd $_
git clone git@github.com:damianavila/RISE.git && cd RISE
python setup.py install
In [2]:
import bokeh
import ipywidgets
import pivottablejs

import matplotlib.pyplot as plt
import seaborn as sns
%matplotlib inline

iris = sns.load_dataset("iris")
In [3]:
import string

[w for w in dir(ipywidgets) if w[0] in string.ascii_uppercase]
Out[3]:
['Accordion',
 'BoundedFloatText',
 'BoundedIntText',
 'Box',
 'Button',
 'CallbackDispatcher',
 'Checkbox',
 'Color',
 'ColorPicker',
 'CommInfo',
 'Controller',
 'DOMWidget',
 'Dropdown',
 'EventfulDict',
 'EventfulList',
 'FlexBox',
 'FloatProgress',
 'FloatRangeSlider',
 'FloatSlider',
 'FloatText',
 'HBox',
 'HTML',
 'Image',
 'IntProgress',
 'IntRangeSlider',
 'IntSlider',
 'IntText',
 'Latex',
 'Output',
 'PlaceProxy',
 'Proxy',
 'RadioButtons',
 'Select',
 'SelectMultiple',
 'Tab',
 'Text',
 'Textarea',
 'ToggleButton',
 'ToggleButtons',
 'VBox',
 'Valid',
 'Widget']
In [4]:
ipywidgets.Checkbox()
In [5]:
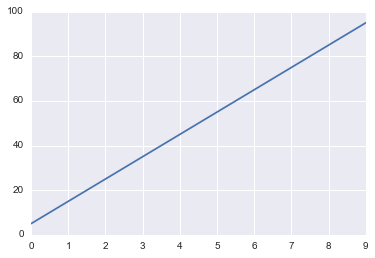
@ipywidgets.interact(
    a=(-10, 10, 1),
    b={'a': 1, 'b': 2.0, 'c': 5.0},
    check=True,
)
def plot_linear_func(a=10, b=1, check=False):
    print("a =", a)
    print("b =", b)
    print("check =", check)

    x = pd.Series(range(10))
    y = a * x + check * b
    plt.plot(y)
a = 10
b = 5.0
check = True
In [6]:
pivottablejs.pivot_ui(iris)
Out[6]: